Corona: Worst Case Scenario and Counter-Measures
Angela Merkel’s Worst Case Scenario
Yesterday (Wednesday, 11 March 2020), Angela Merkel stated at a press conference that the COVID-19 epidemic in Germany could infect sixty to seventy per cent of the population during its full course.
Applying these values to the Austrian overall population (8.8 million inhabitants) would result in an assumed worst case scenario of 5.3 to 6.2 million cases of infection.
These numbers will obviously immediately call into question how far our health system is able to deal with such an epidemic. It is currently too early to make serious, exact forecasts on the course the epidemic is likely to take. Such prognoses are therefore to be taken with great caution. The simulation of this worst case scenario with our model predicts that Austria would have a peak of about 2 million infections at the end of May. While that is an absolute worst case scenario, this number makes it clear why it is necessary to reduce the peak.
Reduction of the epidemic peak
Classic epidemic equations (the Kermack-McKendrick SIR model) show very well that even a minor reduction of the contact rate will clearly reduce the peak of the epidemic. That is the very reason why health minister Anschober demanded a reduction of social contacts by 25 per cent with such vehemence. This reduction would suffice to reduce the peak to 52 per cent of the base value (in the classic SIR model); the peak would therefore be almost halved.
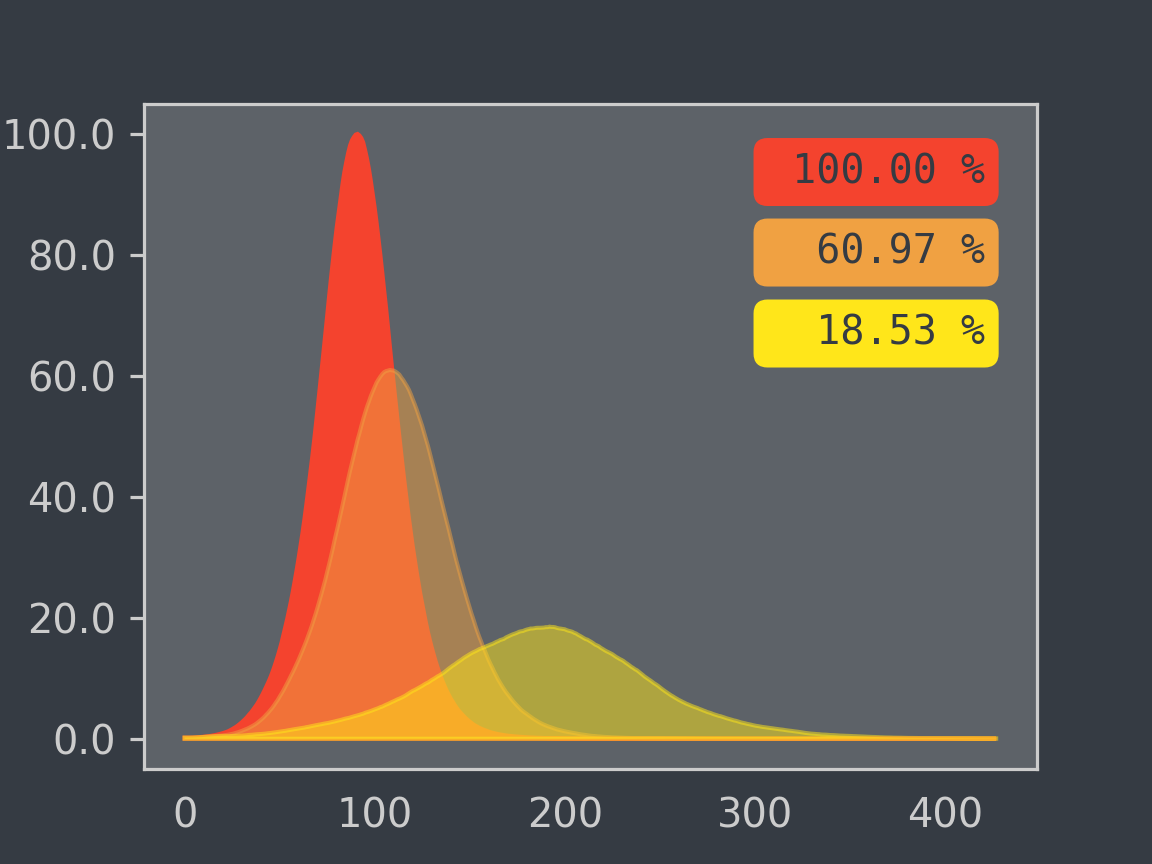
Our agent-based epidemic simulation, which is much more detailed (including more precise demographics of the Austrian population, exact course of the diseases) and is therefore able to create a much more precise image of social interactions, now shows that the measures demanded by Anschober would be even more effective. A 25 per cent reduction of the contact rate results in a reduction of the peak by as much as eighty per cent. Taking the worst case scenario, the peak would therefore have a number of simultaneous infections of ‘only’ 360 thousand people rather than about two million.
The figure depicts the effect a reduction of social contacts has on this peak of the worst case scenario. As basis (100%), it takes the peak without any reduction of social contacts (red curve). The curve depicted in orange shows a reduction of social contacts by ten per cent. The effects our model shows for the demanded reduction of 25 per cent is depicted by the yellow curve.

It is therefore clearly apparent that the reduction demanded by Anschober is absolutely necessary in order to reduce the course of the epidemic to a level that can be managed.
The reason why the numbers are even better than before is that the classic SIR model assumes a homogeneous population. That means that the virus is spread across the population evenly. In our agent-based model, however, there are local contact networks based on geographic conditions. The infection is therefore more likely to spread (largely) within these local networks and still needs to be carried into other contact networks. The reduction of contacts will reduce further the already lower probability that the infection is spread into the next local network. The delay to the spread is therefore greater than that achieved in a homogeneous mix.
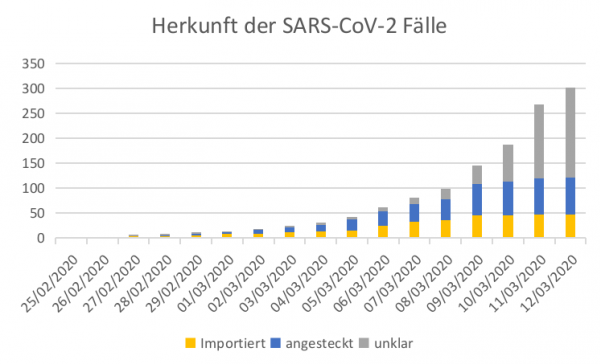
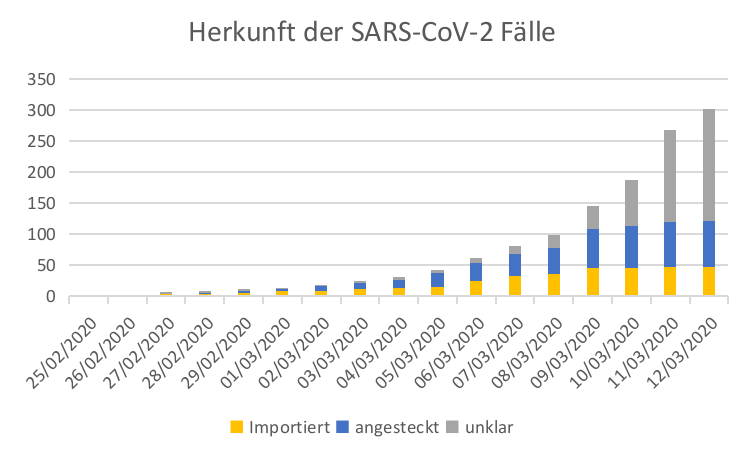
These ‘local mini epidemics’ can be explained among others because a considerable part of the infected persons were not infected in Austria, but were imported (yellow in the diagram). Therefore, there will be local epidemics where for example (almost) a whole family or office will be infected, but after that the disease will be isolated and not spread further.
The efficacy of the 25 per cent measures
Overall, the steps taken by the government to reduce social contacts are welcome in any case. In order to ensure that services can be delivered, as described above, it is absolutely necessary to delay the spread of the epidemic and therefore lower the peak.
We must therefore ask how effective these measures to reduce the contact rate are. Do they reach the right group of persons and are they sufficient for the 25 per cent goal? Do further measures need to be taken?
In order to answer this question in detail, we simulate the effects of the individual measures and of the package as a whole with our model commissioned by the Wiener Krankenanstaltenverbund (KAV). The models and scenarios for Austria overall are created in the framework of the Dexhelpp research programme at TU Vienna and the dwh.
Authors: Š. Emrich, M. Bicher, C. Urach, M. Zechmeister, C. Rippinger, D. Brunmeir
Further information and sources
The basis used is the GEPOC model (M. Bicher, C. Urach, and N. Popper, "GEPOC ABM: A Generic Agent-Based Population Model for Austria") developed within the Dexhelpp project. This is a population model that creates statistic representations for the population of Vienna with the following parameters:
-
Age
-
Gender
-
Place of Residence (GPS coordinates, sampled on the basis of registration districts)
The attendant marginal distributions are taken from data of Statistik Austria as well as the Global Human Settlement Project.
The data and informations on contact rates are taken from:
- POLYMOD study (EU project SP22-CT-2004-502084)
- J. Mossong a.o., ‘Social contacts and mixing patterns relevant to the spread of infectious diseases’, PLoS medicine, Vol. 5, No. 3, 2008.
- R. A. Hill and R. I. Dunbar, ‘Social network size in humans’, Human nature, Vol. 14, No. 1, p. 53–72, 2003.