Chance and Challenge: Vaccination of six Million Doses in Next two Months
Note: This is an automated translation (using DeepL) of the original German article.
Vaccine for mass vaccinations is under way, speedy vaccination and high participation are needed
With the COVID-19 vaccinations it is similar to the train. It takes time for the sluggish machine to start moving and accelerate. But then it goes quickly there. After the initial difficulties with vaccination, the phase of acceleration has now been reached. In the current 2nd quarter Austria will still receive over 6 million vaccine doses.
For comparison: From January, the start of vaccination, to the end of April, 3 million vaccine doses will have been administered in Austria. So 3 million vaccinations in 4 months, or about 750,000 per month. In the 2nd quarter, i.e. in the next 2 months until the end of June, the additional 6 million vaccine doses should be administered as quick as possible. That’s 3 million a month, which is more than four times the pace!
A certain amount of effort is required to achieve and maintain this ambitious pace - averaging 100,000 vaccinations per day. And not from the side of vaccination logistics, but also from the population to participate in the vaccination program.
Planned vaccination scheme will show effect in June
The aim of this vaccination plan is that by the end of June 100% of the population over 65 years of age and around 65% of all young people (who may receive vaccine) can be vaccinated (see news from April 15, 2021). While it is true that this will also immediately have a dampening effect on new infections, the current model shows that the time lag must be analyzed in detail.
Because the following factors must be taken into account:
- Between mid-May and mid-June, a significant portion of the vaccine is planned for the - necessary - 2nd vaccination.
- The vaccination protection is not given immediately, but is built up by the body after the vaccination. This takes an average of 10 days to 3 weeks.
Finally, there is also a third, albeit less powerful, effect: the effectiveness of the vaccination is not 100%, but fluctuates between 75 and 95%. In order to be able to estimate the influence of these effects more precisely, the extrapolated vaccination prognosis (including delay effects, vaccination dates for the 2nd vaccination round, effectiveness, etc.) was integrated into our simulation model. In this way the qualitative influence* of the increasing vaccination coverage on the “normal” infection process can be calculated.
Conclusion:
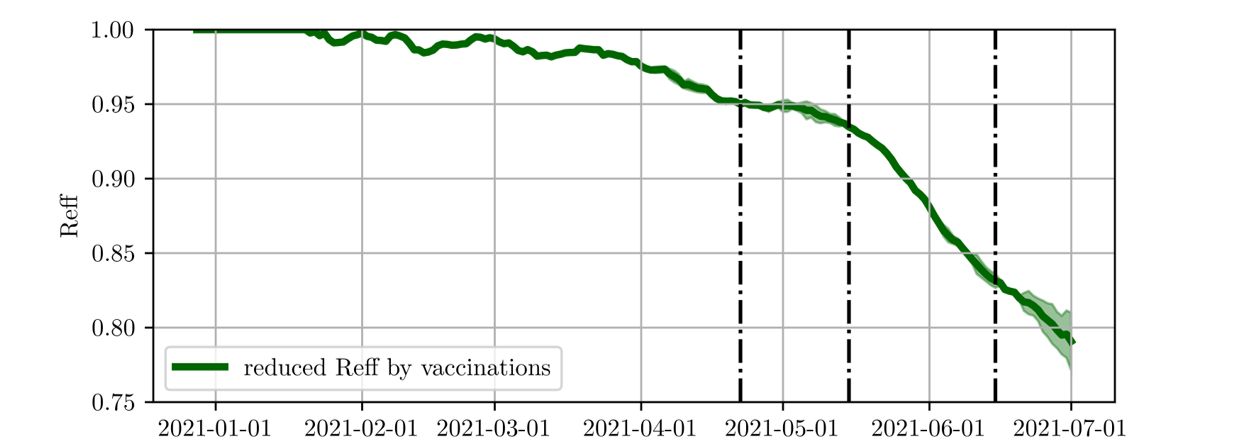
- The vaccination program will not significantly decrease R-eff until the second half of May (see Figure 4).
- Then 65% of all Austrians can be immunized,
- where 40 percent of the people are immunized by the vaccination and 25 by a survived COVID-19 disease (see Fig.2, as well as the corresponding research project)!
- The proportion of severe cases (people requiring intensive care) is already falling. By the end of June, the proportion should have halved compared with the beginning of the year, according to model calculations.
- Notes and Limitations to the study are found at the end of the article.
The results in detail
These calculations (see Fig. 1) show that of the approximately 25% immunized in Austria (as of April 1), only 7% were due to the vaccination (dark blue). While the vast majority (around 18%) can be traced back to survived (diagnosed (light blue) and undiagnosed) COVID-19 diseases.
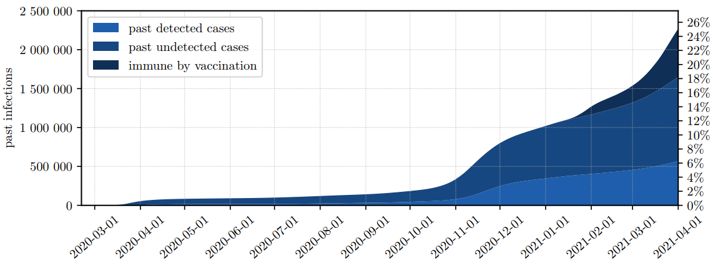
Fig.1: Of the 25% immunized in the Austrian population at the end of April, only 7% are due to the vaccination (dark blue) - the rest to a survived infection.
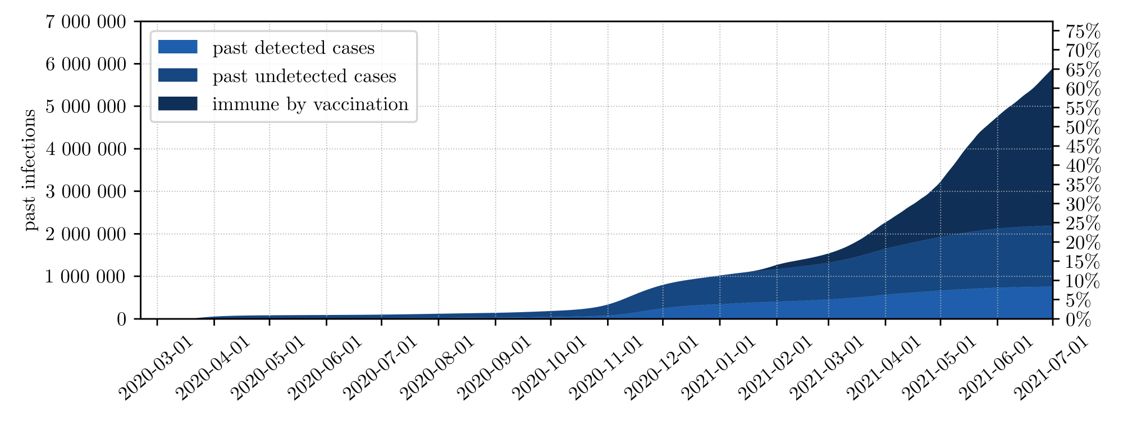
Based on these figures, a qualitative prognosis was calculated (see Figure 2), which includes the planned vaccination program. According to this prognosis, the immunization rate will increase by May 15th. to about 45%, half of which is due to the vaccination (dark blue). From May, however, there will be a small “hump” in the immunization, as many appointments for the 2nd vaccination are due here. This means that fewer primary vaccinations can be administered (see Fig. 3 for the 1st and 2nd vaccination curves).
By mid-June (June 15), the proportion of immunized will then increase to 65% (40% due to the vaccination, survived COVID disease: 25%).
Figures three and four give a more detailed look at the influence of vaccination on the infection process. Figure 3 clearly shows how the number of first vaccinations (red line) “stagnates” between mid-May and mid-June. The reason is the administration of the necessary 2nd vaccination within the prescribed time window. During this time, the proportion of people with the 2nd vaccination (blue line) increases accordingly. After this 2nd round of vaccination, the speed of the first vaccinations increases again.
Because of the second vaccinations, and since vaccination protection is only achieved after about 10-21 days, “only” 3.5 million people will be immunized by the end of June 2021. Despite 9 million vaccinations.

This time delay of the vaccination effect on the infection process can be seen very clearly in figure 4. The figure shows the dampening influence (qualitative) of the mass vaccinations on R-effective. Please note that the illustration only shows the attenuation of R-eff and not the actual R-value!

The green curve describes the reduction in R-eff exclusively due to the vaccination program. It is clear that vaccinations have a minor impact on R-eff by the end of April. R-eff is currently only 5% lower than it would be without a vaccination program.
From the second half of May onwards does the planned vaccination program have a clear impact on R-eff. In the following one and a half months until the end of June, R-eff is then reduced by 20% (compared to the situation without vaccination).
The vaccination machine is now accelerating, and the road is not over yet. But if the logistics are good and the willingness to vaccinate is high, then the course can be set for a “quiet” autumn 2021 in the coming months.
*Qualitative influence:
In contrast to the quantitative influence (e.g. the specific number of new infections to be expected), the qualitative influence describes differences or changes. In this case, the difference between “What is the vaccination process like with and without vaccination?” The result is not a nail-biting figure, but an estimate of the magnitude of the expected effect.
Notes and Limitations
The results of this study were worked out with the help of an agent-based simulation model, whereby the statements are connected with the usual limitations of simulation-based experiments. On the one hand, simplifications were made in the course of the modeling. The following are particularly relevant for the statements in this study:
- The prognosis model does not include the loss of immunization through time or through any mutations!
- The vaccination shown in the model leads to sterilizing immunity. This means that vaccinated people, in whom the vaccination has been effective, can no longer act as disease vectors.
- The vaccination doses inoculated in the period May / June are extrapolations from the expected vaccination deliveries. In the model, these are distributed to the respective age groups according to the national vaccination plan.
- The model does not contain a hypothesis on willingness to vaccinate, but assumes a population that is completely ready to vaccinate by the end of June.
- The epidemic future scenario shown in Figure 2 takes into account a seasonal decrease in the number of cases and does not include any hypotheses about a possible upswing after the current lockdown regime has been lifted.
The number of unreported cases of those infected so far, which can be seen in Figure 1 and 2, is parameterized on the basis of the unreported figure studies by SORA and Statistics Austria and is therefore associated with increased uncertainty.
Furthermore, the study results are limited by known and unknown uncertainties in the parameterization and input data. This includes restrictions in data quality, availability and completeness.