ATC-ICD
In the DEXHELPP project "Comparison of Methods in Epidemiology from Routine Data" a comparison between diabetes prevalences*, estimated by the following three methods, was conducted using different data sources for the years 2006 and 2007:
-
Method ATC-ICD based on data from GAP-DRG (short: ATC-ICD)
-
Method of data collection and extrapolation from ATHIS taking the following variables into consideration:
- ATHIS_Jemals: Information on whether a person ever suffered from diabetes (short: ATHIS_Jemals).
- ATHIS_Behandlung: Information if a person has been treated or has taken medication for diabetes in the last 12 months (short: ATHIS_Behandlung).
-
Method of Diagnoses Assignment by ExpertInnen (short: ExpertInnen)
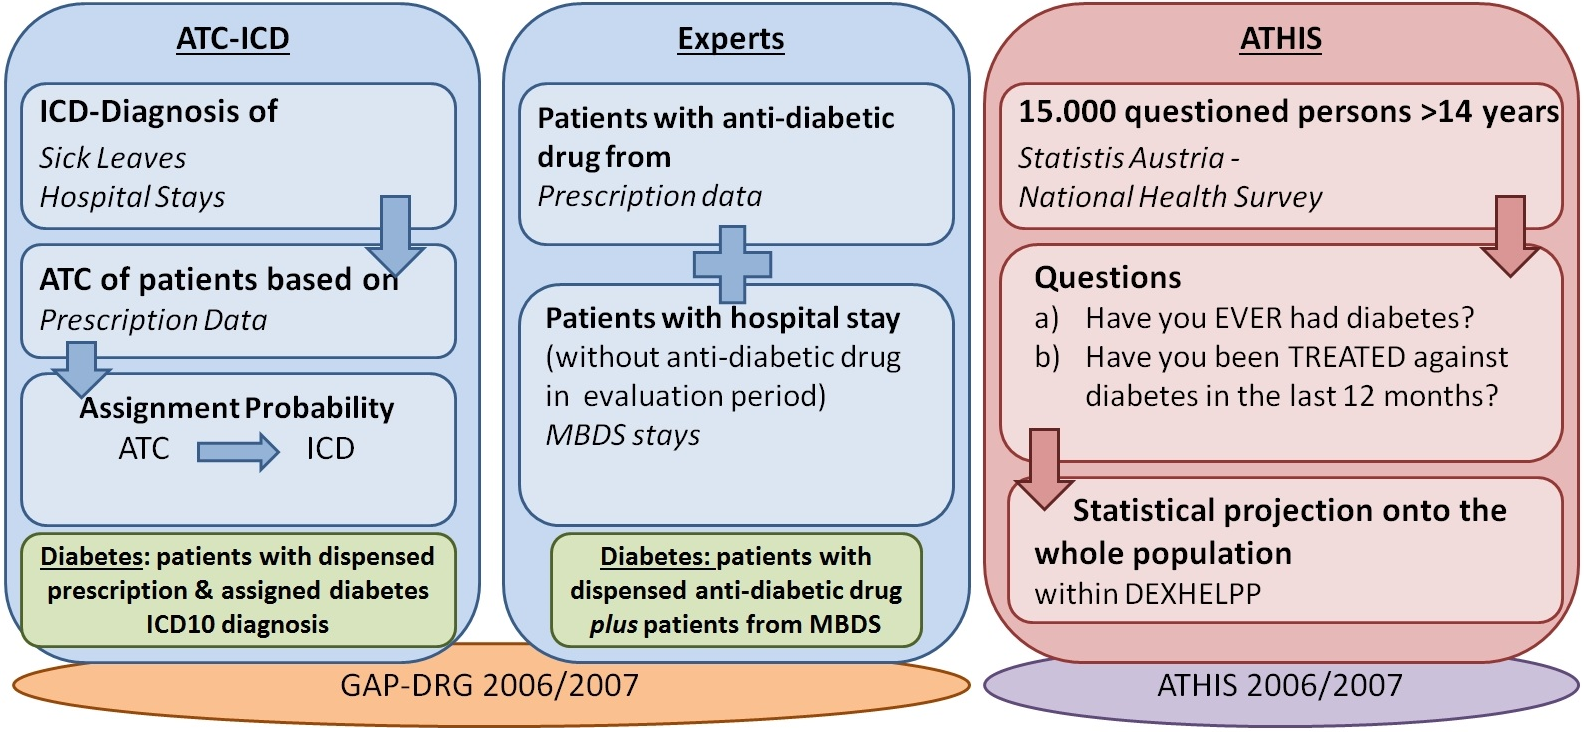
The aim of the project was to establish whether similar proportions of persons suffering from diabetes within the population are accounted for by the various methods. Two of the methods (ATC-ICD and Diagnoses Assignment by ExpertInnen) pursue mainly a pharmacoepidemiological approach based upon reimbursement data for drugs by the social insurance funds. Reference figures used are the results of the Austrian Health Interview Survey (ATHIS – Austrian Health Interview Survey) 2006/2007 – obtained from the questions "Have you ever had diabetes?" and "Have you received treatment or taken medication because of this health problem in the last 12 months?“
Below the results obtained by the methods ATHIS, ATC-ICD and Diagnoses Assignment by ExpertInnen are displayed and compared.
* Morbidit
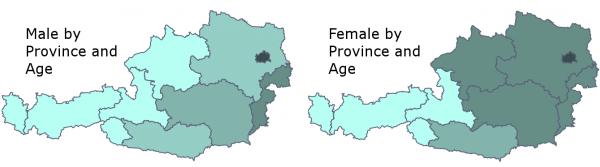
Comparison 1 - Display by age, gender and province
On the two maps below (one for male and one for female), age groups can be selected by using the drop down menu. Switching between "←" and "→" displays the results obtained by each of the methods ATC-ICD, ATHIS_Jemals, ATHIS_Behandlung, and ExpertInnen. Please click on the maps.
Comparison 2 - Display by gender
For the initial direct comparison of these methods, data were analysed solely by gender. By switching the methods ATC-ICD, ATHIS_Jemals, ATHIS_Behandlung and ExpertInnen, divided by male and female, can be inserted into the bar chart. Please click on the bars.

Comparison 3 - Display by age
A further direct comparison presents the prevalences per 10,000 residents by age groups at an aggregated level. The bar chart displays the methods ATC-ICD, ATHIS_Jemals, ATHIS_Behandlung and ExpertInnen by age category. Switching, displays different age groups. Please click on the bars.

Comparison 4 – Display by provinces
A comparison of the results when differentiated by province, and revealed by the methods ATC-ICD, ATHIS_Jemals, ATHIS_Behandlung and ExpertInnen, is presented in the map below. Please click on the map.
