New Study Published in Scientific Reports
Model-based analysis of population immunization level and its braking effect on effective reproductive number was published
Note: This is an automated translation (using DeepL) of the original German article.
Since March 2021, monthly updates on population immunization levels against current SARS-CoV-2 variants can be found at http://www.dexhelpp.at/de/immunisierungsgrad/ (German only). This evaluation is highly relevant because it tells us how high the natural braking effect of immunized people is on the pandemic. Indeed, for the spread of the disease, they act like a breakwater in contact networks, since chains of infection cannot propagate across them. If the population’s immunization level is above a certain barrier, the virus can no longer spread enough to cause an increase in cases - this is known as herd protection or herd immunity.
But even before the immunity level reaches the herd immunity mark, there are clear braking effects. In a recent publication in the journal Scientific Reports, we addressed the issue of how to quantify this braking effect using epidemiological models. Here we compared two approaches: The classical SIR (Susceptible-Infectious-Recovered) approach with differential equations and the individual-based one with agent-based modeling. Although both methods are well suited to model epidemic behavior, slightly different results are obtained.
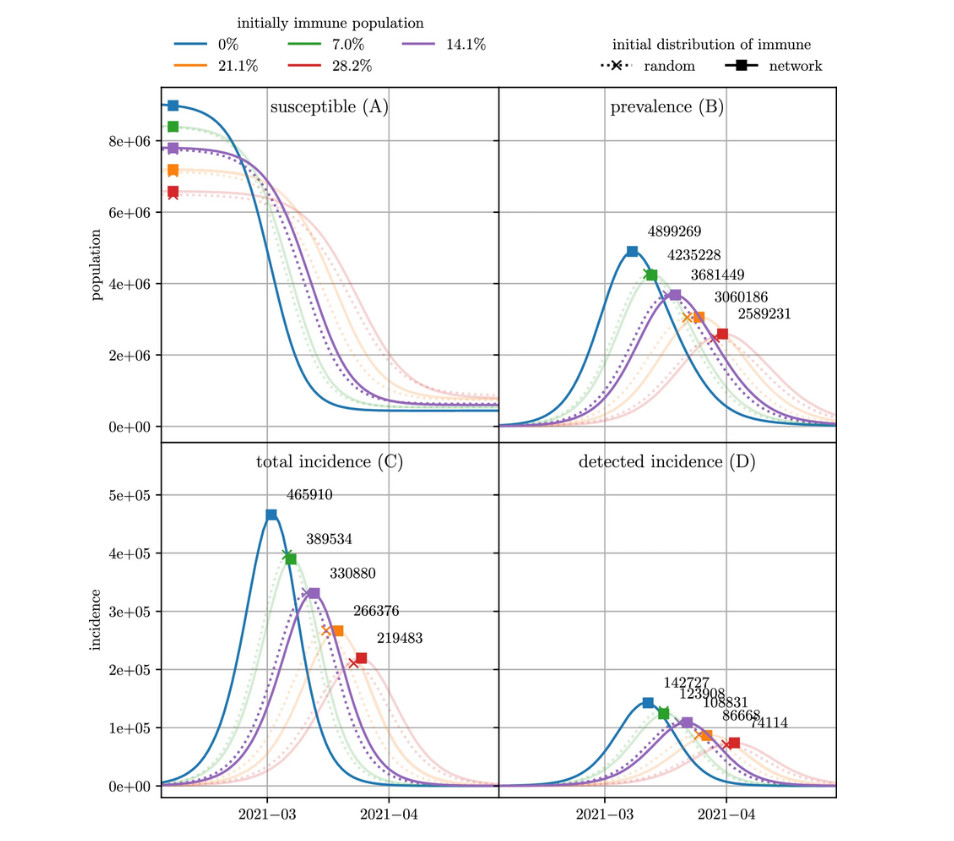
Using this study, we found that the existing immunity level in February 2021 of about 14.7% of the population, which was primarily due to vaccination at that time, had a braking effect of about 9% in terms of the effective reproductive number. This effect is roughly equivalent to a moderate contact restriction measure or large-scale screening with quarantine, but was nowhere near high enough to stop a pandemic wave.
On February 1, 2022, the immunity level reached a level of about 65%, which reduces the effective reproduction rate by about 58%. A correspondingly strong (individual) measure is sought in vain. This massive braking effect will soon lead to a decline of the Omicron wave without additional contact restriction measures.
Unfortunately, the immunity level of the population is always only a snapshot. This is because new variants, seasonality, and declining vaccination/health protection over time cause the population’s immunity level to continually decline. Therefore, to keep the level high through the summer and into the fall, appropriate re-vaccinations are necessary.
Note (2/22/2022):
The next immunization level update will occur early next week (early March) and can be viewed here (in German only).